Security policies are used to enforce rules on transit traffic. Transit traffic is traffic that is not destined to the SRX device. Host inbound traffic is not controlled using security policies.
Security policies affect the traffic from one zone and exiting another zone. The combinations of a from-zone and a to-zone is called context. Every context has an ordered list o policies and the list is processed top to bottom.
Security policies are stateful in nature. That means that return traffic is allowed by default. The SRX device will drop all traffic that is not explicitly permitted by a security policy.
- Source zone (based on ingress interface)
- Destination zone (based on route lookup)
- Source IP address
- Destination IP address (after static and destination NAT translation)
- Source port
- Destination port (after destination NAT translation)
- Logical system
- User identity
- Protocol
- Source IP address
- Destination IP address
- Source port
- Destination port
- Protocol
The SRX device uses these 5 elements to determine whether a packet belongs to an existing session or not.
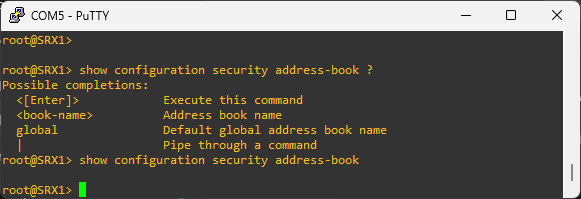
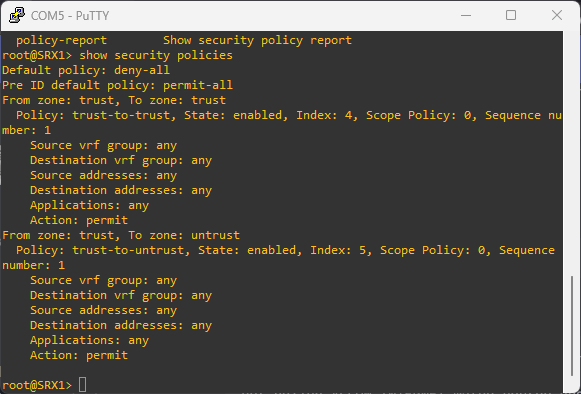
To see configured security policies, run:
show security policies
To create an ew security policy , run:
edit security policies from-zone TRUST to-zone ZONE-A

set policy ALLOW-INTERNET match source-address any
set policy ALLOW-INTERNET match destination-address any
set policy ALLOW-INTERNET match application any

set policy ALLOW-INTERNET then permit
Since policies are evaluated from top to bottom, if there is a need to move a policy, we can do that with:
edit security policies from-zone ZONE-A to-zone UNTRUST

insert policy ALLOW-INTERNET before policy DENY-ALL
Source and destination addresses are two of the five match criteria that should be configured in a security policy. You can now configure wildcard addresses for the source and destination address match criteria in a security policy. A wildcard address is represented as A.B.C.D/wildcard-mask. For example 10.10.10.10/255.255.0.255.
The wildcard address usage is not restricted to full octets only. You can configure any wildcard address. For example, the wildcard address 172.16.0.1/255.255.18.255. But The first octet of the wildcard mask should be greater than 128. For example, a wildcard mask represented as 0.255.0.255 or 1.255.0.255 is invalid.
Configuring wildcard security policies on a device affects performance and memory usage based on the number of wildcard policies configured per from-zone and to-zone context. Therefore, you can only configure a maximum of 480 wildcard policies for a specific from-zone and to-zone context.
-
permit: the packet is permitted based on the initial packet policy lookup
-
reject: for TCP packet, and TCP reset is sent. UDP, ICMP, and any other IP protocol, an ICMP reset is sent.
-
deny: the packet is silently dropped
-
count: counts bytes or kilobytes of all traffic the policy allows to pass through the devices in both directions.
-
log: logs traffic information for the policy
Multiple security policies may have similar match criteria. Policy precedence rules will determine which policy will be applied first. Here is the matching order:
-
Intrazone policies: The ingress and egress interfaces are in the same zone. For example from-zone ZONE-A to-zone ZONE-A
-
Interzone policies: The ingress and egress interfaces are in different zones. For example from-zone ZONE-A to-zone ZONE-B.
-
Global policies: They are evaluated if the packet does not match intrazone or interzone context. Global security policies are ordered and also evaluated from top to bottom.
-
Default action: The default policy denies all traffic by default. It can be configured with set security policies default-policy deny-all. This policy is evaluated if the packet does not much the context of intrazone, interzone, global policies.
A scheduler is a configuration that allows a security policy to be activated during certain time. For example if we want to allow certain vendors on weekends.
A scheduler can be associated with multiple security policies but a policy can be associated with only one scheduler. When a scheduler is inactive, a policy is unavailable for lookup.
edit schedulers scheduler VENDER-WEEKEND-SCHEDULE

set saturday all-day
set sunday all-day
To see the status of schedulers, run:
show schedulers
To attach a scheduler to a policy,
edit security policies from-zone ZONE-A to-zone ZONE-B policy VENDER-POLICY

set scheduler-name VENDER-WEEKEND-SCHEDULE
Traditional security policies permit or reject traffic based on layer 3 or layer 4 information. We use IP addresses and port number to determine what traffic is allow to go through the SRX device. For example, we can control applications such as HTTP, SMTP, and DNS because these applications used well-known standards ports only. This approach is limited especially when dealing with evasive applications.
Juniper Networks application firewall (AppFW) provides policy-based enforcement and control on traffic based on application signatures. By using AppFW, you can block any application traffic not sanctioned by the enterprise. AppFW enables us to enforce the policy control on Layer 7 traffic.
For AppFW to work, we need to have the Application identification license installed on the SRX device. We also need to download and install the application signatures package, a predefined signature database of applications.
Unified security policies allow the use of dynamic applications as match criteria along with layer 3 and layer 4 information. So traffic is classified using layer 4 to layer 7 information and policy actions are applied based on identified application.
Unified policies leverage the application identity information from the application identification (AppID) service to permit, deny, reject, or redirect the traffic. A unified policy configuration handles all application firewall functionality and simplifies the task of configuring a firewall policy.
Unified security policies are easier to configure and is more granular.
To block Facebook:
set security policies from-zone ZONE-A to-zone ZONE-B policy BLOCK-FACEBOOK match dynamic-application junos:FACEBOOK-ACCESS
Use show system license in operational mode to see if the required license is installed on the SRX device. Make sure appid-sig is installed and available.
Download the application signatures with:
request services application-identification download. Check the status of the download with request services application-identification download status.
Install the package with:
request services application-identification install. Check the status of the installation with request services application-identification install status.
To learn more about any predefined application, run the operational command show services application-identification application detail junos:FACEBOOK-ACCESS.
To enable the IDP, we need to have the appropriate license installed, and we need to have the signature database downloaded and installed. Then we can configure IDP policy and enable security policy for IDP inspection.
A IDP policy configuration looks like:
set security policies from-zone ZONE-A to-zone ZONE-B policy ALL-WEB then permit application-services idp-policy IDP-POLICY-1
IDP is part of the security policy configuration. It is enabled per policy bases.
When an attack have been identified, Junos execute an IDP action. Here are IDP actions:
no-actionignore-connectiondifserv-markingclass-of-servicedrop-packetdrop-connectionclose-clientclose-serverclose-client-and-serverrecommended
See installed license with show system license. IDP license is indicated by idp-sig in the SRX device.
Run request security idp security-package download to download the security package. Append status to see the download status. check-server shows more details about the package to be downloaded.
We can download the IDP policy template with request security idp security-package download policy-templates. Install the package with request security idp security-package install policy-templates.
Then add the download templates.xsl into the configuration database. For that we run set system scripts commit file templates.xsl
To learn more about an attack object, run:
show security idp attack attack-list predefined-group [GROUP-NAME]
To learn more about an IDP policy, run:
show security idp attack attack-list policy [POLICY-NAME]
To create a custom IDP policy, run:
set security idp idp-policy POLICY-1
then configure the policy to fit our need.
To configure an IDP inspect in a security policy, run:
set security policies from-zone ZONE-A to-zone ZONE-B policy ALL-WEB then permit application-services idp-policy POLICY-1
show security idp status
will show us IDP status.
The integrated user firewall is a mechanism to use user information as match criteria for security policies. This feature retrieves the user-to-ip address mapping information from Windows Active Directory.
Note that tracking for non Windows Active Directory is not supported and multiple users logged to the same device is also not supported. In addition the LDAP authentication performed is simple authentication. So the username and password are sent in clear text.